 Disk Size Manager
 | Home | Product: Disk Size Manager |
Help Section
Getting Started | Main Menu | Main Toolbar | Subsidiary Drive/Folder Scanning Toolbar | Graph/Details Area | Subsidiary Graph Toolbar | Application Options | File/Folders Search | Regular Expressions | Wasted Space | Notes on NTFS
Subsidiary Graph Toolbar
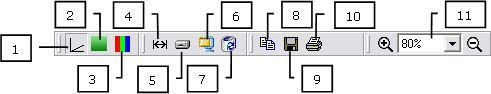
1. 3D switch between 2D/3D modes
2. Show background gradient turn on/off the background.
3. Setup colors define start and end color for the gradient background. Indicate the same start and end color to make the background solid.
4. Show size show graphically normal size for folders (available for bar graphs).
5. Show disk usage show graphically disk usage for folders (available for bar graphs).
6. Show compressed show graphically compressed size for folders (available for bar graphs).
7. Show unused excess show graphically unused excess for folders (available for bar graphs).
8. Copy to clipboard copy the picture from the graph area into the clipboard.
9. Save to file save the picture from the graph area into a file of graphic format.
10. Print graph print the picture from the graph area.
11. Zoom adjust the scale of the graph.
 |
|
 |